
Cedar class learning for 25 JUN 2020
English: LO: to create a picture for a headline.
Newspapers make use of pictures to make them look more appealing to the reader. Pictures also contribute to the detail of the article; a famous saying is ‘a picture is worth a thousand words’, so a good article with a good picture is going to be very informative!
Today I would like you to create a picture for one of the below headlines. Draw a picture which matches the headline, and then create a caption for your picture; the caption describes what is happening in the picture or adds a bit of extra detail to it.
Flash flood ruins wedding!
Chaos as robot dog goes on the run.
Eggcitement at Easter event.
Boom! Building collapses due to loud music.
Maths: LO: to find fractions of measurements.
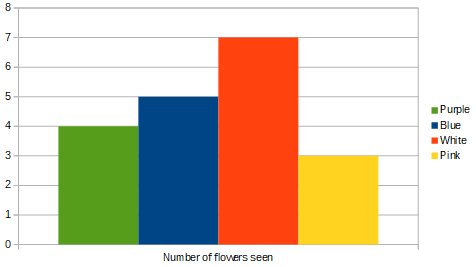
So far you have collected and presented data. Now that you have your data clearly presented in a chart or graph you can make statements about it. For example, my graph below shows that the majority of flowers in my garden are white. I can also clearly see that I have fewer pink flowers than any other flower colour.
Today, I would like you to create a bar chart for the following data. Once you have created your bar chart, write some statements about what the data show.
Different colours of cars in Tesco car park:
Black – 42
Blue – 31
Silver – 55
Gold – 4
Red – 18